I come across an useful tool to monitoring web application performance — newrelic.com
It come very handy to find the root cause for the bottleneck issue in one of our PHP application. I managed to pinpoint where exactly the root cause of the problem from the useful graph of the newrelic dashboard.
If you are familiar with xdebug tool which can be used to drill down the function being called that lead to the highest load or waiting time.
Newrelic dashboard APM offer almost similar thing, but the different is almost realtime with the agent installed on the application host.
In order to install the newrelic agent, firstly you need to register an account in newrelic.com
Luckily they had just offered FREE access for minimal dashboard.
previously it had trial 14-days. the detail are as below.
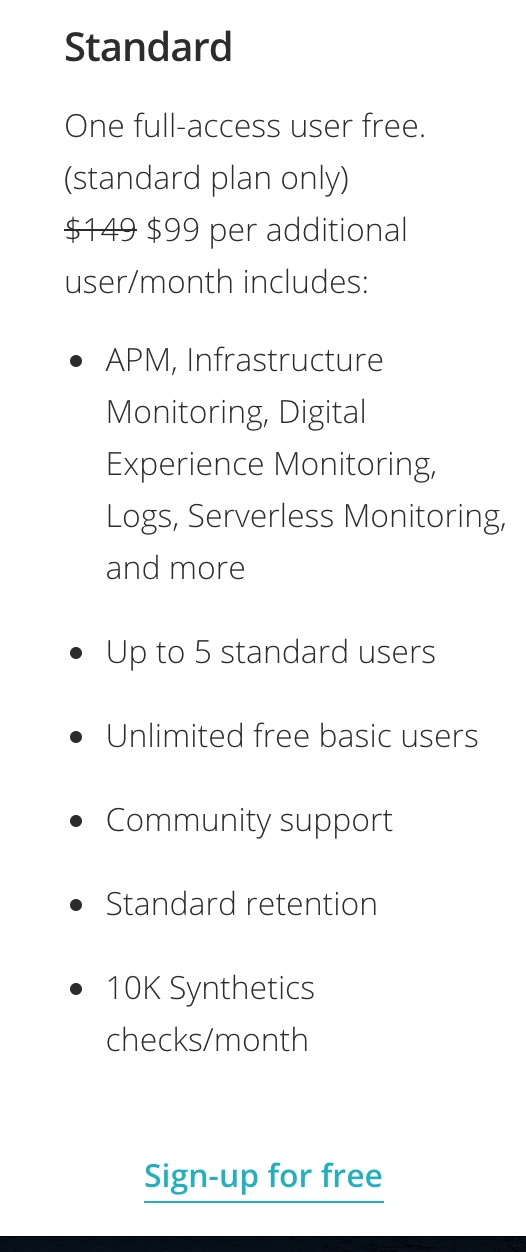
You can head to their website to find out their features and sign up for its free access.
After signup you can then find the license_key that will be needed for the infra agent setup.
Sample of installation step for the centos or redhat based OS would be as simple as below:
# Create a configuration file and add your license key
echo "license_key: xxxxx" | tee -a /etc/newrelic-infra.yml
# Create the agent’s yum repository \
<
curl -o /etc/yum.repos.d/newrelic-infra.repo https://download.newrelic.com/infrastructure_agent/linux/yum/el/6/x86_64/newrelic-infra.repo
# Update your yum cache
yum -q makecache -y --disablerepo='*' --enablerepo='newrelic-infra'
# Run the installation script
yum install newrelic-infra -y
then just start it. and after few minutes of traffic, you can start analysing the result in the newrelic dashboard.
Goodluck!